Benchmark your university endowment for long-term strength
Benchmarking a university endowment against its peers can offer valuable perspective, and the NACUBO-Commonfund Study of Endowments is one of the most widely used resources. The most recent NACUBO endowment study surveyed 657 participating institutions, revealing trends in university endowment performance, spending, asset allocation and other metrics for the 2025 fiscal year—July 1, 2024, to June 30, 2025.
Yet research like this is only a starting point. The best measure of success is whether an endowment supports institutional goals while also preserving long-term financial strength. Each institution faces unique pressures—like enrollment declines and rising costs—that should influence how higher-education leaders interpret the results.
Key takeaways
- Endowment benchmarking data is useful but must be assessed alongside institutional context and goals to inform decision-making.
- Key trends in the 2025 NACUBO study include rising spending and greater reliance on university endowments to fund operations, which may challenge long-term sustainability.
- Strong governance and aligning spending and investment policies can help preserve an endowment's purchasing power over time.
Key insights from the 2025 NACUBO endowment study
Both university leadership and donors often ask how their endowments compare with those of their peers. Benchmarking helps answer this question by examining metrics like investment performance, asset allocation and spending patterns across institutions of similar size and structure.
"A lot of the endowment managers we work with look at the NACUBO data every year to help them determine a spending rate and also to help them gauge their investment performance," says Hank Dunbar, Senior Vice President and Charitable and Philanthropic Strategist with First Citizens Wealth. "Growth of funds is also important, particularly within the endowment's size range."
However, Dunbar notes that the benchmarks shouldn't be viewed in isolation. "Effective benchmarking for a university endowment should connect external data with internal priorities, such as mission, liquidity needs and risk tolerance."
Below are five key insights from the 2025 NACUBO study—and perspectives on what they could mean for endowment managers going forward.
1Strong overall investment performance
Endowments posted solid returns in 2025, growing an average of 10.9% year over year for all institutions. This represents a small decline from 2024's 11.2% return, but it’s a notable increase from 2023's 7.7%.
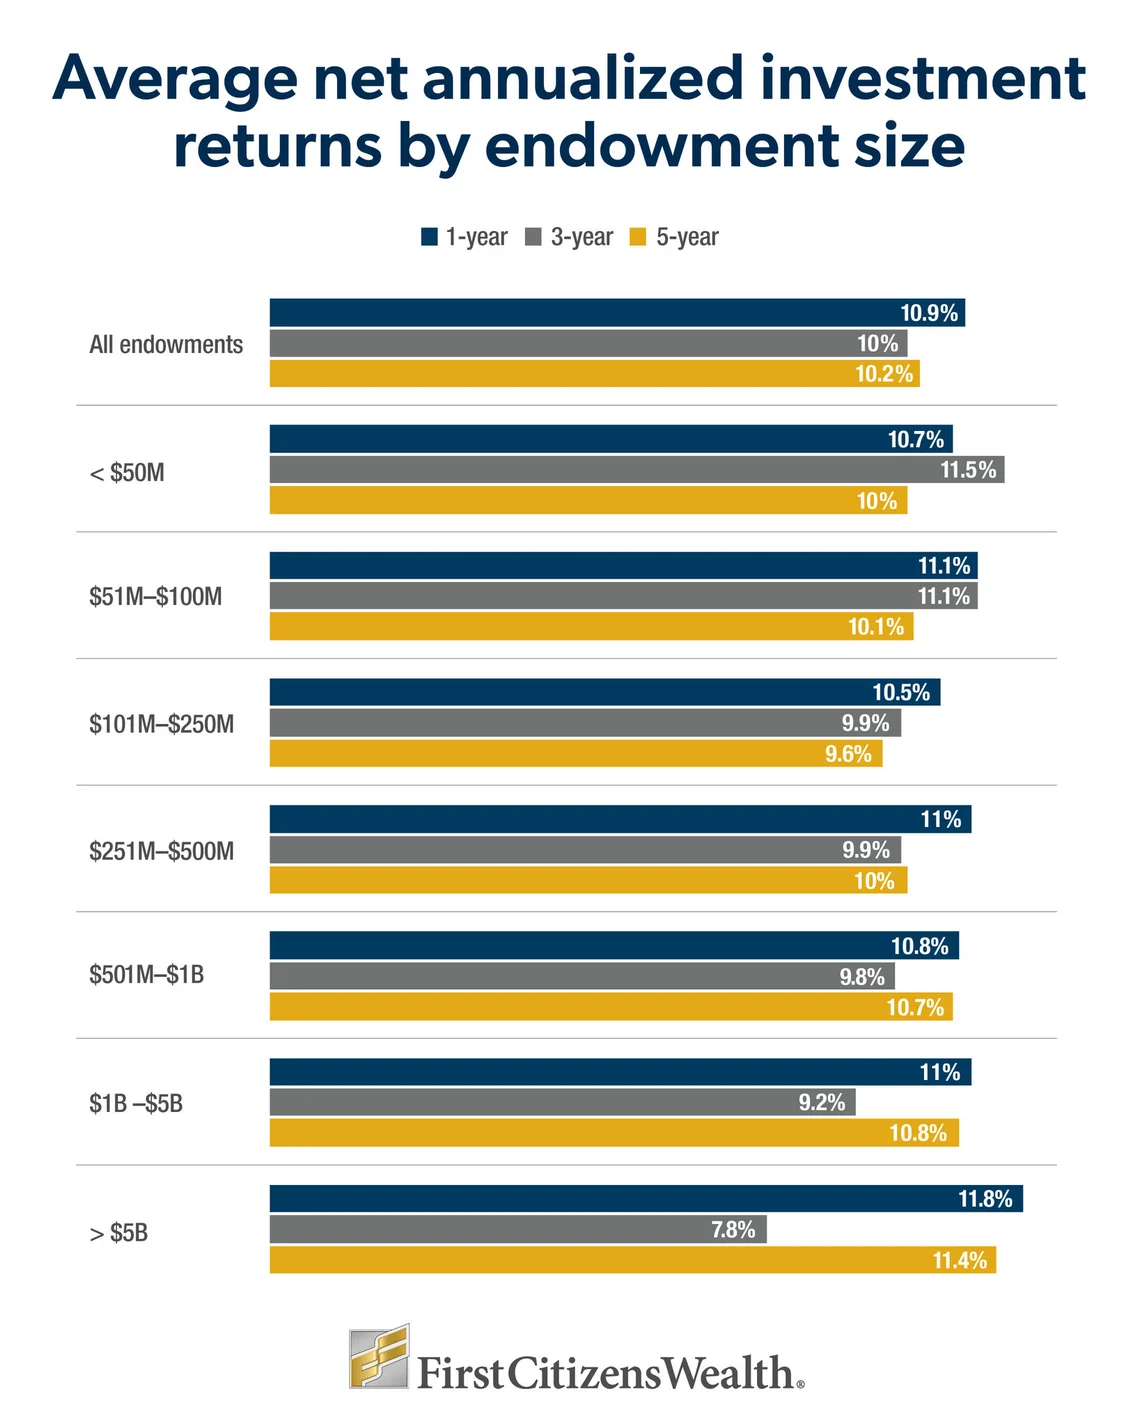
"It's important to consider these recent strong returns for endowments in context," says Brandon Whitley, CFP®, an Institutional Consultant with First Citizens Wealth. "In the 5 years since the end of COVID, we've had this very strong equity market delivering double-digit returns nearly every year. As a result, we've had a lot of conversations with clients around wanting to capitalize on that."
But while strong performance often creates opportunities, favorable market conditions may not last. "It's important to regularly reassess risk exposure, spending assumptions and expectations for long-term returns," he adds.
2Asset allocation heavily weighted to equities
Among all participants, equities accounted for 86% of portfolios in 2025—31.5% in public equities and 54.5% in private markets. Fixed income accounted for 11%, while other asset classes made up the remaining 3%.
"What's happened over the past decade is that strong equity market performance has shifted portfolio positioning for many institutions," explains Andy Johnson, Senior Director for Institutional Asset Management with First Citizens Wealth. "In some cases, portfolios that were once closer to a traditional 60/40 allocation have moved toward a heavier equity tilt—often 70/30 or higher—driven by outsized returns in public markets."
This shift can increase risk if it's not actively managed. As Johnson notes, institutions that haven't regularly rebalanced may now be more exposed to equity market volatility—particularly in a less stable environment.
Johnson also cites emerging challenges within private markets. "Recently, there have been some challenges in private equity where it's actually underperformed relative to public markets," he says. "We're seeing similar concerns in private credit, which has become a key focus for many institutions."
Dollar-weighted asset allocations for endowments in 2025
|
Total institutions |
Less than $50 million |
$251 million to $500 million |
More than $5 billion |
|
|---|---|---|---|---|
|
Private equities |
16.8% |
3% |
11.5% |
19.2% |
|
Marketable alternatives |
15.4% |
3.3% |
10.4% |
17.4% |
|
US equities |
13.7% |
44% |
27.1% |
9.5% |
|
Private venture capital |
12.2% |
0.8% |
3.2% |
14.4% |
|
Fixed income |
10.7% |
26.1% |
16.7% |
8.2% |
|
Real assets |
9.7% |
4.8% |
6.3% |
11.1% |
|
Global equities |
9% |
2.7% |
9.5% |
7.9% |
|
Non-US equities |
5.4% |
10.7% |
8.4% |
3.8% |
|
Emerging markets |
3.4% |
2.7% |
2.8% |
3.4% |
|
Secondaries |
0.3% |
0.4% |
0.6% |
0.3% |
|
Sustainable investments |
0.1% |
0.2% |
0.3% |
0.1% |
|
Other |
3.4% |
1.2% |
3.3% |
4.7% |
Note: Columns may not add up to 100% due to rounding.
Allocation differences by endowment size
It's worth noting that allocation patterns typically vary by endowment size. For example, in the study, institutions with assets of less than $50 million reported allocating only 12.5% to alternative investments in 2025, compared with 62.5% for those with more than $5 billion in assets.
In addition, fixed-income allocations ranged from 20% to 26% for the three smallest size cohorts, but just 8.2% for the largest.
These differences reflect a trade-off between growth and liquidity. Institutions should align asset allocation with their return objectives and cash flow needs.
3Growing reliance on endowments for operations
Institutions withdrew $33.4 billion from their endowments in 2025, an 11% increase year over year and a more than 17% increase over the past 2 years. In addition, endowments funded 15.2% of operating budgets, up from 10.9% just 2 years earlier.
This spending was allocated across several areas:
- 47.4% on student financial aid
- 17.7% on academic programs and research
- 10.8% on endowed faculty positions
- 7.6% on campus operations and maintenance
- 16.6% for other purposes
Dunbar says this overreliance can challenge long-term sustainability. "In a world where you're having difficulty paying day-to-day bills, it may be difficult to focus on growth," he explains. "You think you need general operating contributions more than you need endowment contributions, but you really need a good balance."
4Average spending rates trending higher
Among all participating institutions, the average spending rate was 4.9% in 2025—up modestly from 4.8% in 2024. The highest average annual effective spending rate was 5.5%, reported for institutions with assets between $51 million and $100 million.
In comparison, endowments of less than $50 million spent 4.5% of their assets in 2025, while those with assets between $501 million and $1 billion spent 4.3%—the lowest rate among all size cohorts.
"We tend to monitor spending rates over multiple years to make sure we're not just seeing a short-term deviation," Whitley says. "More recently, we are seeing some sustained increases, and that is something we want to watch carefully."
This upward trend in spending rates may reflect broader financial pressures, including enrollment challenges.
5Declining enrollment remains top concern
Enrollment challenges remain a top concern—and a key factor behind rising endowment spending.
In both the 2024 and 2025 NACUBO studies, many institutions consistently identified declining enrollment as a major pressure. "Due to multiple factors, enrollment trends haven't been favorable in recent years, and declining birth rates following the 2008 financial crisis will create further challenges," Whitley explains. "As fewer students reach college age, competition for enrollment will continue to intensify."
And as institutions face tighter budgets and fewer incoming students, many are relying more heavily on endowment distributions to help bridge funding gaps.
"You're starting to see the spend rate tick up," Whitley says. "That aligns with what we're seeing—and would expect—from higher overall costs due to inflation and enrollment challenges. Many smaller private colleges in particular are feeling the pressure of this challenging environment, which is coming through clearly in the data."
Strategies for long-term endowment sustainability
Taken together, the trends highlighted in the NACUBO study—strong returns, rising spending and increased reliance on endowments—underscore the importance of disciplined long-term planning. For many institutions, the challenge is balancing near-term financial pressures with the need to preserve purchasing power over time.
These strategies can help align decision-making with long-term sustainability.
Align spending and investment policies
Sustainable endowment management depends on alignment between spending needs and investment strategy. Many institutions target spending rates around 4% to 4.5% because exceeding this range can introduce additional risk, particularly in periods of market uncertainty.
At its core, the framework is straightforward—spending needs plus inflation, fees and a growth factor determine the return required from the portfolio.
"If a school needs to spend 7%, you've got to add in inflation, fees and growth. And if you end up with 10%, your investment policy has to support that," Dunbar explains. "At a 10% required return, you might require more return generating assets to achieve your institution's goals and objectives."
Alternatively, institutions may begin with expected portfolio returns and set spending accordingly. In either case, aligning these policies helps ensure the endowment can support current needs while preserving long-term financial strength.
Manage liquidity and investment risk
Larger endowments often allocate more heavily to private markets and alternatives, while smaller institutions tend to rely more on public markets.
"That's because smaller funds typically have more challenges around managing the illiquidity of private and alternative investments," Whitley explains. "You're essentially locking up your funds, and in the midst of a potentially challenging environment you may need to tap into those investments."
Recent market conditions also highlight the importance of monitoring overall risk exposure. Strong equity performance has led some portfolios to become more heavily weighted toward equities, potentially increasing vulnerability in more volatile environments.
Regularly reassessing asset allocation can help ensure portfolios remain aligned with both risk tolerance and spending needs.
Strengthen governance and endowment fund oversight
Effective governance is a critical component of sustainability. Institutions should regularly review endowment agreements—along with endowment investment strategy and spending policies—to ensure they align with donor intent and current needs.
For example, in some cases, endowment funds may be misclassified or unnecessarily restricted, limiting their usefulness. "Some gifts don't actually have to be restricted," Dunbar explains. "I recently spent time reviewing all of one college's endowment agreements, and I was able to identify a large pool of funds that could be used for immediate needs."
In addition, legal frameworks such as the Uniform Prudent Management of Institutional Funds Act can provide institutions with flexibility to reinterpret or modify certain donor restrictions when circumstances change. This can help ensure that funds remain usable while still honoring donor intent.
Dunbar notes that institutions are increasingly taking a more proactive approach. They're reviewing legacy agreements and updating language in new charitable gift agreements to avoid unnecessary constraints in the future.
The bottom line
The NACUBO study provides valuable insight into how endowments are evolving, but benchmarking alone isn't enough. The most meaningful measure of success is whether an endowment can support institutional needs today while preserving financial strength for the future. By aligning spending, investment strategy and governance practices, institutions can use benchmarking not only as a comparison tool but also as a guide to long-term sustainability.
Working with an experienced institutional advisor can help bring these elements together. In addition to asset management, many endowments benefit from more comprehensive support. "As part of the advisory team at First Citizens Wealth, we also help clients with policy development and proper administration because practices can vary widely and mistakes are common," Dunbar says.
Whitley adds that this support often centers on establishing consistent governance frameworks. "It really comes down to best practices—aligning investment policy, spending policy and endowment governance so everything works together."