Sponsor trends report: Market recap and 2026 outlook
Ken Caffrey
Managing Director of Sponsor Finance
Chris Todaro
Managing Director, Head of Underwriting and Portfolio Management
Jake Ledbetter
CFA | Senior Researcher of Market Insights
For sponsor finance teams, understanding where private capital is moving matters as much as how deals are financed. This outlook examines the trends shaping how sponsors are deploying capital, from add-ons and onshoring to policy-aligned investing and AI-driven infrastructure.

Drawing on data and conversations with market participants, it reflects what sponsor finance clients are seeing and where the smart money is moving in 2026.
Key takeaways
- Add-ons hit a high-water mark in terms of their share of buyout activity as sponsors double down on the integration and operational growth playbook.
- Tariffs and trade realignment are steering investment into domestic manufacturing, offering opportunities in ancillary sectors that are often highly fragmented.
- The line between Wall Street and Washington is getting thinner as sponsors invest behind regulation and public funding.
A tale of two markets
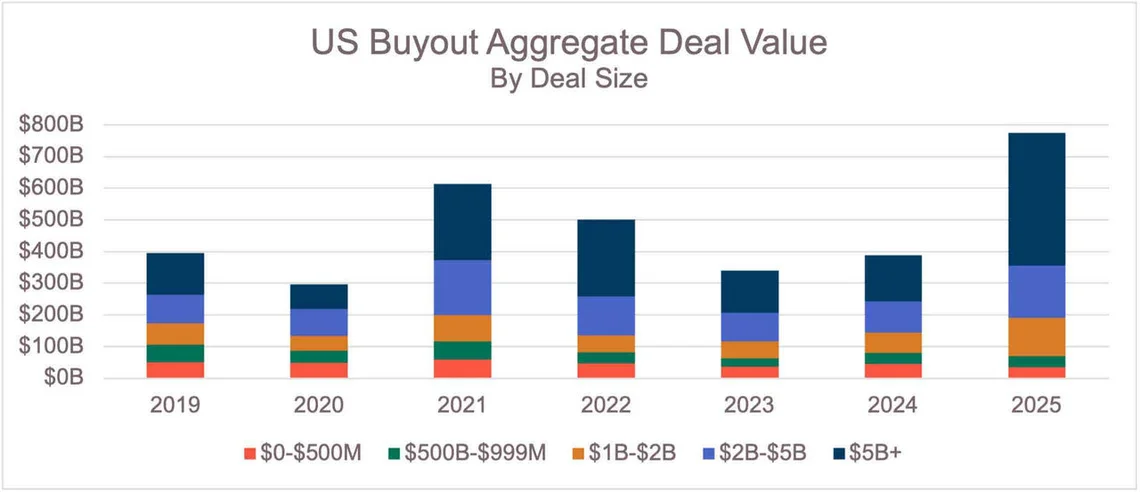
Private equity, or PE, sponsors enter 2026 on contradictory footing—with record activity but restrained confidence. Total buyout investment surged this year, surpassing even the highs of 2021. However, this was driven largely by $5 billion and higher transactions, such as the $55 billion Electronic Arts deal and the Aligned Data Centers' $40 billion buyout.
Excluding those large deals, the picture looks much more like pre-2020 normalcy. Deals smaller than $1 billion—the lifeblood of the middle market—have remained largely flat in dollar terms and are characterized by fierce competition for high-quality assets. The market is unmistakably bifurcated: exuberant at the top but grinding in the middle and at the lower end.
The same dynamic shows up in exits. According to PitchBook data, exit value has ticked higher in 2025—$419 billion in PE-backed exit value as of late November, compared to 2024's $269 billion. While exit deal value is up, exit deal count remains muted at the lowest level in over a decade. A few headline sales—such as xAI's $33 billion acquisition of X or the $24 billion Walgreens deal—skew the total, keeping the dollar figures high while the broader market remains thin.
The result is a tale of two markets. At the top end of the market, large sums of capital are moving fast. But in the middle market, it's a steady pace and muted energy. Sponsors are active but frequently cite increased competition and a difficult environment that together require more discipline.
This dynamic is shaping how firms are thinking about 2026. Rather than chasing growth for its own sake, sponsors are concentrating on structural and strategic opportunities where secular forces can still deliver meaningful returns.
Building value one add-on at a time
After a sluggish few years, platform investing has quietly become the dominant PE playbook—acquiring smaller companies as a foundation, then building through targeted add-ons to expand geography, product mix and customer base. By deal count, add-ons consistently represent over 70% of the total number of buyout deals. And by dollar amount, their representation is rising. According to PitchBook data, in 2025 add-ons accounted for approximately 19% of all US buyouts by dollar amount, up from 14% the prior 2 years. At nearly $140 billion in deal volume, 2025 represents a peak in add-on activity since at least 2000.

Middle market firms in particular are doubling down on platform plays. The opportunity is clearest in fragmented industries, where scale still creates efficiency and defensibility. But simply getting bigger isn't enough to command premium valuations anymore.
Shoreline Equity Partners, a Jacksonville-based PE firm focused on the lower middle market, has seen the model evolve firsthand.
"In the past, it was all about scale," says Peter Bouret, Vice President at Shoreline. "Today, there is a broader emphasis across the market on commercial strategy." This emphasis on execution over financial engineering reflects a broader market shift. "Many firms are placing more attention on organic growth metrics as one factor considered in valuation discussions," he adds.
In a market crowded with competition and limited opportunities, firms are focusing on commercial strategy—improving pricing, sales and execution—rather than counting on multiple expansion.
This operational intensity also mirrors the longer hold periods defining today's market due to the sluggish exit environment. This gives sponsors more time—and pressure—to prove real business transformation. The best performers are those using this extra time to find the right management team and operating partners that will drive a successful integration strategy.
"Integration is a frequent challenge in the industry," Bouret says. "We have established a portfolio support group to help executives with everything from operations to HR to financial strategy."
The strategy of focusing on operations, organic growth and integration isn't new, but it's become a defining feature of today's market. Heading into 2026, a successful add-on playbook is becoming a defining theme of this part of the market cycle. The next wave of outperformance won't necessarily come from going bigger faster—it will come from smarter integration, disciplined add-ons and genuine organic growth.
The quiet winners of onshoring
Policy has played its part over the past decade. From legislative landmarks like the Inflation Reduction Act and the Creating Helpful Incentives to Produce Semiconductors, or CHIPS Act, to executive actions on trade and tariffs, the concept of Made in America has become a serious proposition.
Manufacturing output has surged as companies seek to bring production closer to the point of consumption—often to the US but increasingly to Mexico and Latin America, where supply chain risk, cost pressures and geopolitical volatility converge into one of this decade's most talked-about opportunities.
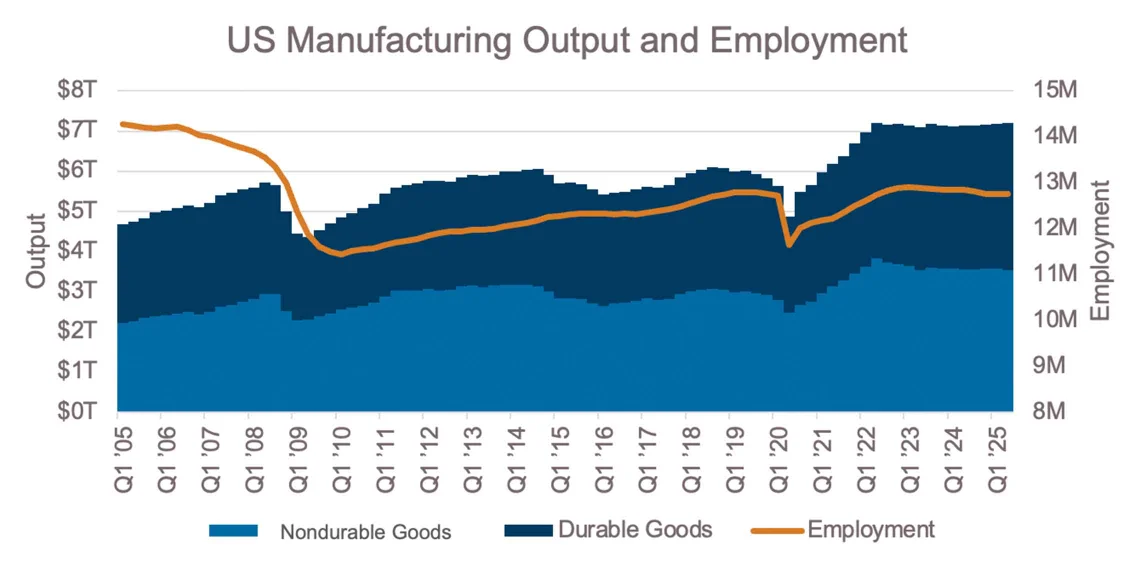
Despite an uptick in output, employment hasn't kept pace. US manufacturing employment never recovered from the global financial crisis and continues to slip. Production is coming back, but the people who know how to run and maintain it aren't. This disconnect is shaping where the real opportunity lies.
The winners of onshoring may not be the manufacturers making the headlines but rather the companies that keep factories running: maintenance and repair, safety infrastructure, plant equipment, spare parts and other mission-critical support. Every day, there's a new announcement about investment in local production, but for every new plant there are a dozen businesses behind it that make it run. After decades of decreasing manufacturing employment, there's a growing shortage of talent with critical machinery or maintenance knowledge. When a manufacturer can't hire internally, it buys the equipment or expertise externally.
So as production returns to the US, the whole industrial support ecosystem scales with it. From an investment perspective, that's the unlock. The most compelling opportunities in onshoring aren't always the new production facilities but rather the companies that supply and support those factories. These businesses tend to share the traits middle market sponsors like recurring or contracted revenue, sticky customer relations and fragmented markets. It's exactly these kinds of areas that are often overlooked in the onshoring discourse but core to the opportunity set for private investors.
Of course, none of this moves in a straight line. The past 2 decades have seen an increase in manufacturing output in the US, but the past year or two has brought a pause. According to the Federal Reserve Economic Data, manufacturing output has leveled off, and total construction spending on manufacturing sites has decreased from $240 billion in the third quarter of 2024 to $226 billion in the second quarter of 2025 on an annualized basis.
Manufacturers are somewhat more cautious about large CapEx decisions today, as tariff and macro uncertainty have pushed some executives into wait-and-see mode. Yet the structural drivers still point toward divesting from China, reducing geopolitical risk, shortening supply chains and building the ability to produce products close to the consumer cost-effectively. Advances in automation further tilt the economics toward onshoring and near-shoring, reducing the amount of relatively expensive labor required in higher-cost North America.
Looking ahead to 2026 and beyond, the direction seems clear: more production closer to home and a growing ecosystem of suppliers and service providers rising with it. Policy may continue to shift—sometimes abruptly—but the underlying forces are durable.
Policy meets capital
The line between private capital and government is blurring fast—and not because of regulation in the traditional sense. Policy itself has become an investable signal.
Sponsors are no longer just navigating the regulatory rulebook—they're reading it for opportunities. Tariffs, industrial policy and a flood of federal funding over the past several years have turned once-bureaucratic sectors into real sources of alpha.
The Broadband Equity Access and Deployment, or BEAD, program alone—a $42 billion broadband expansion effort—has sponsors circling fiber installation, engineering and logistics firms that stand to ride a wave of public investment. Meanwhile, government reshoring incentives and defense spending growth are drawing capital into manufacturing, cybersecurity and mission-critical infrastructure.
Since 2019, annual US venture capital, or VC, investment into defense technology has exceeded the annual budget for the Defense Advanced Research Projects Agency, or DARPA, according to data from PitchBook. This represents a major shift in how government- and military-related innovation is financed.
This isn't necessarily a pivot by private capital toward politics. When exit markets are slow and private market competition is high, government spending looks a lot like guaranteed demand. Sponsors are underwriting around core government missions—broadband access, national security and domestic supply chains—and avoiding policy fads that hinge on who holds the gavel in Congress. No one campaigns against infrastructure, manufacturing and defense—but if it serves both parties, it's probably safe, sustainable capital.
The Inflation Reduction Act is a great example of the stickiness of these projects. While the act's consumer-focused tax credits for things like electric vehicles were cut by a new administration, credits for domestic advanced manufacturing remained largely untouched, according to At One Ventures.
Ben Carson Jr., co-founder of FVLCRUM, a Washington, DC-based middle market PE firm investing in government-adjacent sectors put it simply. "The way to get familiar with these dynamics is to have real relationships in DC," he notes. "If questions about a regulatory matter come up, it's best to have a conversation with experts on the Hill. There's still a lot of information to process, but being connected to this network is the only way to get a direct answer instead of waiting for the media to report it out."
FVLCRUM's investments capture the moment —a telecom infrastructure platform, a government consultancy and an IT provider with public-sector clients. These are deals that exist at the intersection of public mission and private capital.
Heading into 2026, this alignment between policy and private capital is set to deepen. The globalization era was defined by chasing efficiencies abroad. This era of regionalization is about building resilience closer to home. As tariffs, industrial policy and federal programs redirect capital flows, investors are learning that many paths to growth increasingly run through Washington. Sponsors are positioning early and recognizing that in today's market, understanding government priorities is the new due diligence.
AI infrastructure's ripple effect: Where sponsors are really playing
The AI megatrend is driving investment in private markets, and it's not only name-brand VC funds leading the charge. AI-driven growth in compute demand is leading to an explosion in data center development—a sector already booming from a decade of cloud computing growth. According to McKinsey, demand for data center capacity is projected to increase between 18% and 27% annually over the next 5 years.
In the past, data centers housed servers for dozens of clients in one building, with this diversified client base paying monthly fees based on the space they occupied. This was an attractive model for PE investors who pursued leveraged finance deals, backed by the recurring cash flows.
Over time, however, hyperscale cloud companies like Microsoft, Amazon and Oracle created public cloud services, gradually replacing the need for many companies to have their own physical servers. In recent years, the fastest growing area of the market is data centers leased to a single hyperscaler to support cloud computing and, increasingly, AI.
While many of the hyperscalers develop their own data centers, they are more frequently leasing from third-party operators who can meet their time-to-market requirements for bringing new capacity online.
"These data centers are typically leased for 10 to 20 years to some of the highest credit-quality tech companies in the US," says Jeremy Wolfe, Managing Director of technology, media and telecom for First Citizens. "The long-term contractual recurring cash flow with annual escalators backed by investment-grade counterparties has driven valuations higher and pushed traditional PE sponsors to other areas of the market."
The significant amount of capital required to build these data centers has favored the largest sponsors with the deepest pools of capital. The longer hold horizons and lower return targets attract infrastructure equity investors, while traditional PE investors rotate out of this area of the market.
PE today is playing a different role in the data center landscape. Rather than building out the data centers themselves, the focus has shifted squarely to ancillary support businesses, professional services, data center maintenance and software. Sponsors' attention is now focused on the bottlenecks that determine whether new data center capacity can come online. The biggest is power, a constraint that's only expected to grow in the coming years.
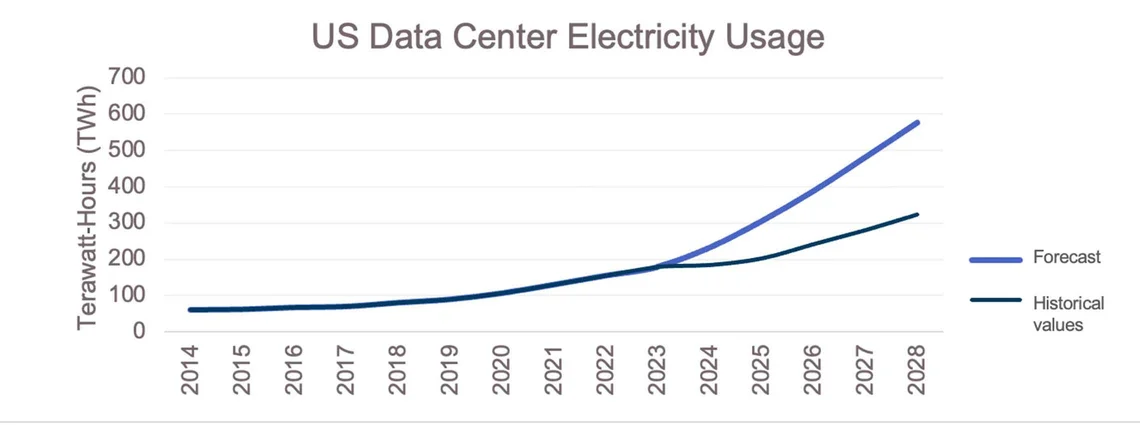
AI workloads consume more electricity than traditional cloud computing, pushing utilities and grids to the edge of available capacity. As a result, sponsors are concentrating on companies that solve energy constraints. Businesses with replacement cycles, service contracts and naturally recurring relationships are far more aligned with a middle market investment playbook than ground-up data center development.
The second cluster of activity is emerging around mission-critical uptime. While AI training can be done with lower accepted uptime levels, AI inference and cloud computing require reliability. As the AI wave shifts from training to inference, opportunities are created in specialized labor and maintenance providers that ensure performance.
CoolSys—a provider of HVAC and other services—is a good example. Bought by Ares in 2019, the company has served as a platform, acquiring more than 10 companies to expand its reach, both in the data center and adjacent markets, according to PitchBook and PE Hub. On the services side, firms like Shermco—an electrical testing company acquired by Blackstone and Hitachi Energy—and Congruex—a digital infrastructure platform created by Crestview Partners—show how sponsors are consolidating the specialized labor and know-how that keeps high-density compute online.
The fate of companies like these doesn't depend on which tech company ultimately dominates the AI race. Their upside is driven by the ongoing need for more capacity and higher reliability in data center operations. In 2026, the value creation will follow the companies that make this capacity possible.
Fortune favors the disciplined
Taken together, these themes point to a 2026 in which sponsors aren't chasing the biggest or loudest opportunities—they're chasing the most durable ones. Platform add-ons will continue to require sharper integration. The rewards of onshoring will be felt beyond the headline-grabbing factory buildouts to the less flashy ecosystem of companies that keep those factories running.
Government programs are creating upside for those that can see through the news cycle to the longer-term bipartisan priorities. And finally, the AI megatrend favors sponsors focused on energy, uptime and specialized capabilities over data center ownership. The firms that win will be the ones that match capital to durability, not capital to headlines.