Market Outlook · April 15, 2025

The Four Cornerstones for Staying Invested

Brent Ciliano CFA | SVP, Chief Investment Officer

Phillip Neuhart SVP | Director of Market and Economic Research

Blake Taylor VP, Market and Economic Research Analyst


Making Sense logo | First Citizens Bank

In an unpredictable financial landscape, market swings can be overwhelming and lead investors to question their long-term investment allocation. But history shows that staying invested despite market volatility is essential.

Here are four reasons to stay invested during a volatile market.

1Market timing is a dangerous game

We're often asked, "Should I move to cash until the market rebounds?" To make gains through market timing, investors must get it right twice—first to sell before the market downturn, and then to reinvest before the market begins to recover.

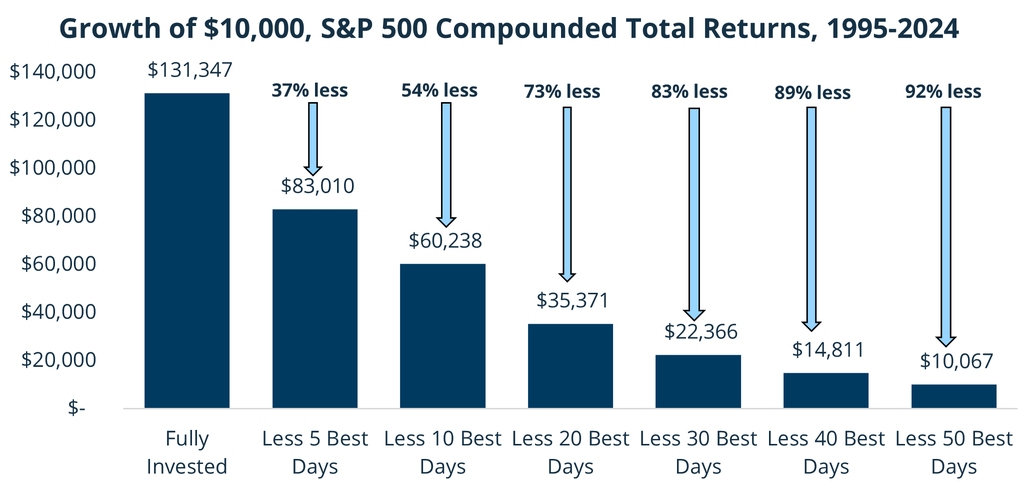
The latter may be the most detrimental, especially during times of extreme volatility. Missing even just 5 of the S&P 500's best days proves costly. While attempting to avoid sharp declines during volatility, it's unfortunately all too common for investors to miss the early days of the subsequent rally.

For some concrete data points, consider that 48% of the S&P 500 Index's strongest days occurred during a bear market. Another 28% of the market's best days took place in the first 2 months of a bull market—before it was clear that a bull market had begun.

A combined 76% of the S&P 500's best days occurred when investors wouldn't likely have wanted to be in the market. April 9, 2025, is a recent example. The market rallied 9.5% in the midst of tariff turmoil, representing the 10th largest gain in the S&P 500 since at least 1928.

Missing even a few of the best market days can be costly

Infographic depicting the growth of $10,000 through S&P 500 compounded total returns from 1995 to 2024
  • The chart shows the growth of $10,000 through S&P 500 compounded returns from January 1, 1995, to December 31, 2024
  • The chart illustrates that missing even a few of the best market days can be costly

Source: Strategas, First Citizens Wealth, NDR Research

2The S&P 500 has recovered fairly quickly after most drawdowns

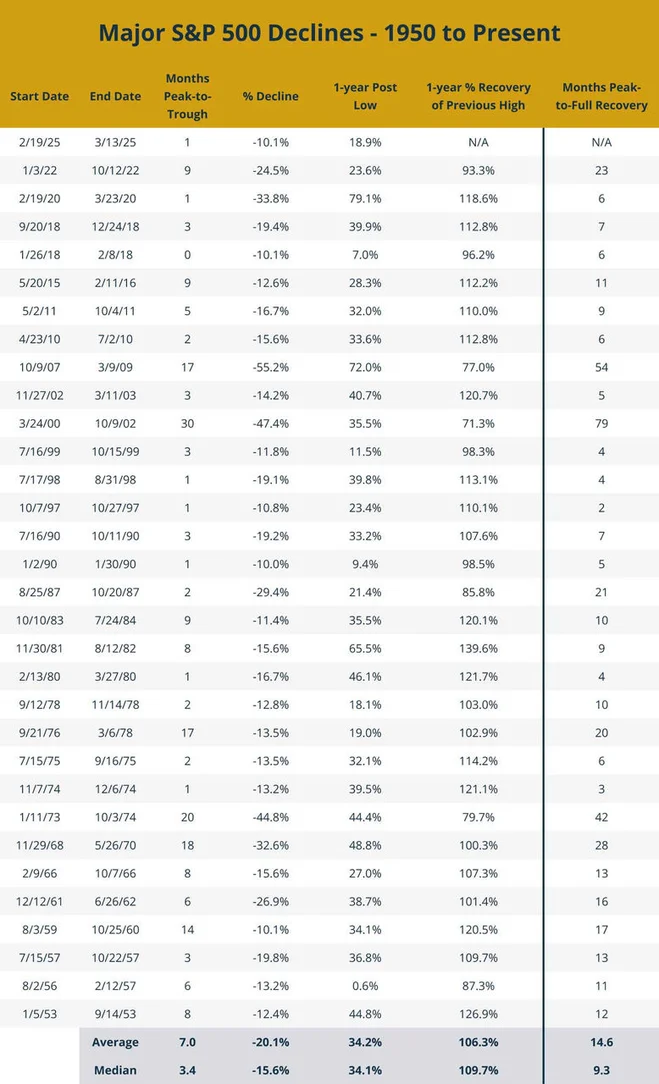
When reviewing market drawdowns of 10% or greater since World War II, in both recessionary and nonrecessionary circumstances the average duration of a drawdown lasted less than 10 months. On average, investors regained more than 100% of losses 1 year after the bottom of the drawdown.

Let's put the current market volatility into recent historical perspective. As of the time of this writing, the S&P 500's peak drawdown since the February 19 all-time high was 18.9%. Markets have recently recovered from these lows.

We don't yet know if the market has achieved its cycle low, but that's the point—it's difficult to time short-term equity market moves. History shows that while it may take some time, the stock market eventually recovers to its previous highs.

Time to full recovery for >10% drawdowns, recessionary and non-recessionary

Infographic depicting major S&P 500 declines from 1950 to the present
  • The chart shows the timing of major S&P declines from 1950 to the present
  • The chart includes the time to full recovery for less than 10% drawdowns, both recessionary and non-recessionary

Source: Bloomberg, Strategas, Goldman Sachs, First Citizens Wealth

3Returns during and after a recession

We're not calling for an imminent recession in our base case. However, many investors are concerned that the probability has risen since earlier this year. It's important to keep in mind that recessions are a strong indicator of forward returns in the months and years following.

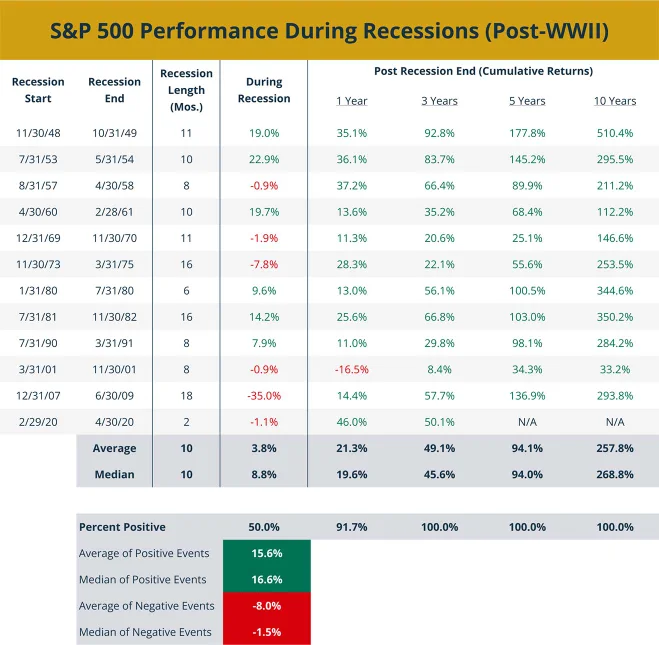
On average, 1, 3, 5 and 10 years post-recession, the S&P 500 has posted positive cumulative returns 92%, 100%, 100%, and 100% of the time, respectively. Even during a recession, market returns are a coin flip between positive and negative returns. So while a market recession is certainly hard going, returns are historically greener on the other side.

Performance 1, 3, 5 and 10 years post-recessions

Infographic depicting the S&P 500's performance during recessions since World War II
  • The chart depicts the S&P 500's performance during a recession since just after World War 2
  • Performance focuses on 1, 3, 5 and 10 years after each recession

Source: NBER, Bloomberg, Goldman Sachs Investment Research

4The best of timing versus the worst of timing

Despite the temptation to wait for an opportunity to enter markets, putting cash to work increases the likelihood of investor success. Inversely, remaining on the sidelines can leave investors behind.

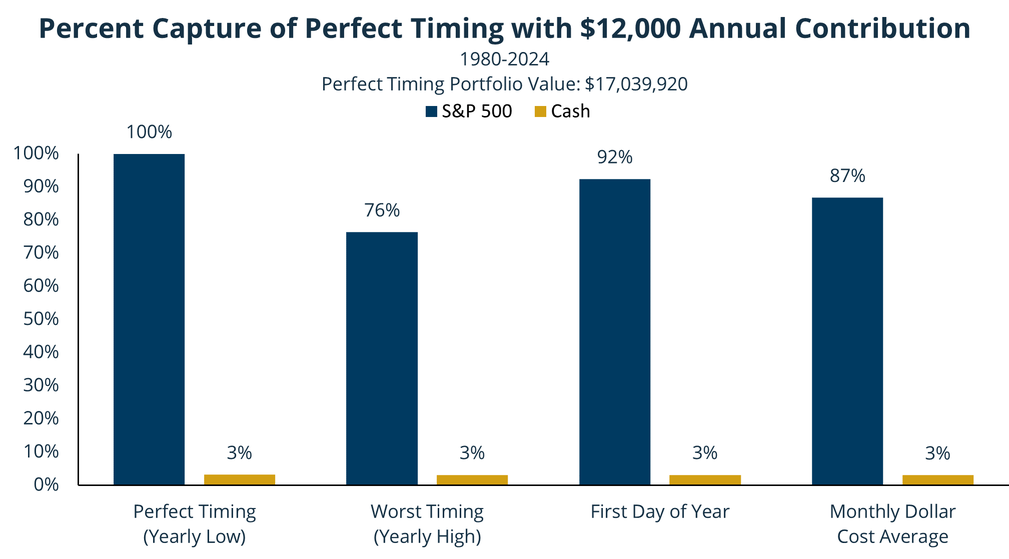
Whether you have the best timing, worst timing or something in between, it's all about the importance of simply time in the markets. If a market participant invested $12,000 each year from 1980 through 2024 and somehow had perfect timing—or bought every year at the yearly low—they would have generated over $17 million, thanks to compounded returns.

Most investors fear the worst timing or buying at the market high every year. Even if that were the case, investors still capture 76% of perfect timing. If an investor simply bought on the first day of the year or monthly dollar-cost averaged at $1,000 per month, they would have captured 92% and 87% of perfect timing, respectively.

The price of the sidelines

Infographic depicting the percent capture of perfect timing with a $12,000 annual contribution
  • The chart shows the percent capture of perfect timing with a $12,000 annual investment contribution from 1980 to 2024.

Source: Bloomberg, First Citizens Wealth

The bottom line

In times of uncertainty and volatility, the importance of a long-term, balanced approach to investing and the essential nature of a financial plan remain paramount.

This material is for informational purposes only and is not intended to be an offer, specific investment strategy, recommendation or solicitation to purchase or sell any security or insurance product, and should not be construed as legal, tax or accounting advice. Please consult with your legal or tax advisor regarding the particular facts and circumstances of your situation prior to making any financial decision. While we believe that the information presented is from reliable sources, we do not represent, warrant or guarantee that it is accurate or complete.

Third parties mentioned are not affiliated with First-Citizens Bank & Trust Company.

Links to third-party websites may have a privacy policy different from First Citizens Bank and may provide less security than this website. First Citizens Bank and its affiliates are not responsible for the products, services and content on any third-party website.

Your investments in securities and insurance products and services are not insured by the FDIC or any other federal government agency and may lose value.  They are not deposits or other obligations of, or guaranteed by any bank or bank affiliate and are subject to investment risks, including possible loss of the principal amounts invested. There is no guarantee that a strategy will achieve its objective.

About the Entities, Brands and Services Offered: First Citizens Wealth® (FCW) is a registered trademark of First Citizens BancShares, Inc., a bank holding company. The following affiliates of First Citizens BancShares are the entities through which FCW products are offered. Brokerage products and services are offered through First Citizens Investor Services, Inc. ("FCIS"), a registered broker-dealer, Member FINRA and SIPC. Advisory services are offered through FCIS, First Citizens Asset Management, Inc. and SVB Wealth LLC, all SEC registered investment advisors. Certain brokerage and advisory products and services may not be available from all investment professionals, in all jurisdictions or to all investors. Insurance products and services are offered through FCIS, a licensed insurance agency. Banking, lending, trust products and services, and certain insurance products and services are offered by First-Citizens Bank & Trust Company, Member FDIC, and an Equal Housing Lender, and SVB, a division of First-Citizens Bank & Trust Company. icon: sys-ehl

All loans provided by First-Citizens Bank & Trust Company and Silicon Valley Bank are subject to underwriting, credit and collateral approval. Financing availability may vary by state. Restrictions may apply. All information contained herein is for informational purposes only and no guarantee is expressed or implied. Rates, terms, programs and underwriting policies are subject to change without notice. This is not a commitment to lend. Terms and conditions apply. NMLSR ID 503941

For more information about FCIS, FCAM or SVBW and its investment professionals, visit FirstCitizens.com/Wealth/Disclosures.

See more about First Citizens Investor Services, Inc. and our investment professionals at FINRA BrokerCheck.